Visualisierung eines Zugnetzes mit GeoServer-Rendering-Transformationen
In the context of the Trafimage geoportal of the swiss railway company SBB geOps was given the task to visualize events and activities along the train tracks. These include planned, ongoing and finished construction work, maintenance tasks and information on equipment along the tracks.
The data to be visualized has a very high information density which makes it challenging to create a visualization without sacrificing much information. Luckily GeoServer supports using WPS processes to be used during the rendering of a map in a WMS request under the name of Rendering Transformations. This feature allows a more complex styling than what is possible using SLD alone by allowing the implementer to modify the features in the rendering pipeline or even draw them on the image of the map directly. We decided to use the approach of the vector-to-vector transformations to be able to modify the incoming geodata and still benefit of GeoServer's rich styling abilites for vector data.
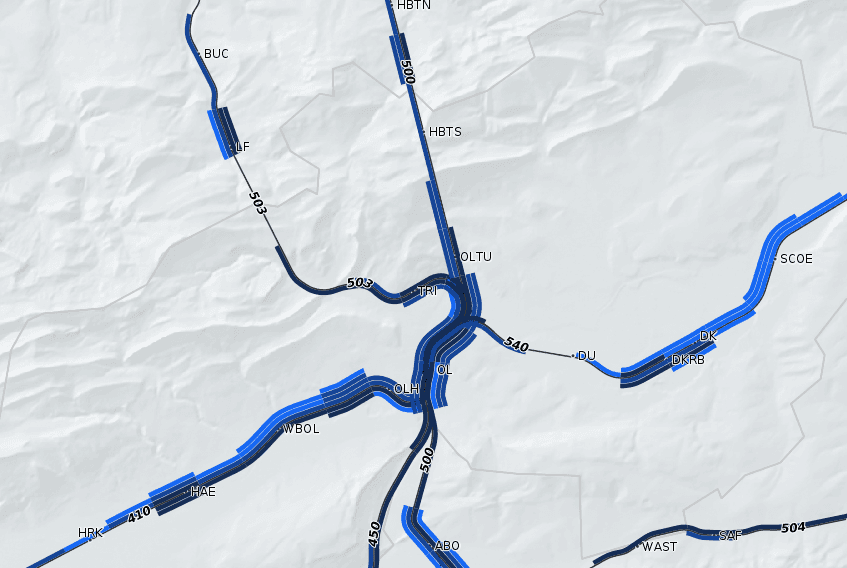
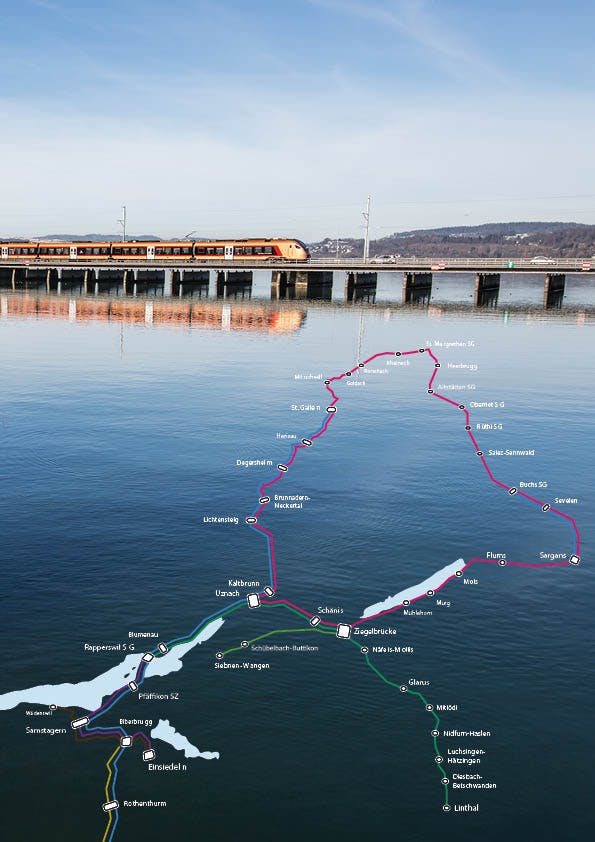
The visualization is based on the whole track network being split into segments based according to the data which will be visualized. There are similar line segments for each event/activity-type at a track. These line segments are then grouped by their geometry and then drawn at an offset parallel to the train tracks. The offset, color as well as the width of these resulting ribbons show the type as well as importance of the visualized event.
There are custom transformations for just stacking line segments along a track as well as for aggregating segments based on their attributes to acheive a weighting by drawing the width of the line in proportion to how many features are part of the aggregation. All of these WPS processes have a high configurability to allow reuse in other contexts.
These rendering transformations are now available as a GeoServer extension on github at github.com/geops/trafimage-geoserver-transformations. The repository also contains instructions on how to build and install the extension to your GeoServer.