Interpolation of height profiles
You know them from planning hikes or bike tours: elevation profiles along a certain route.
They provide information about the meters of altitude covered, the gradients along the route, and the maximum and minimum altitudes. But altitude profiles do not only play a role in everyday life. In public transport, for example, they can help in planning locations for charging stations as part of the use of battery-powered means of transport. This is because the required drive power depends strongly on the altitude profile of the route to be covered.
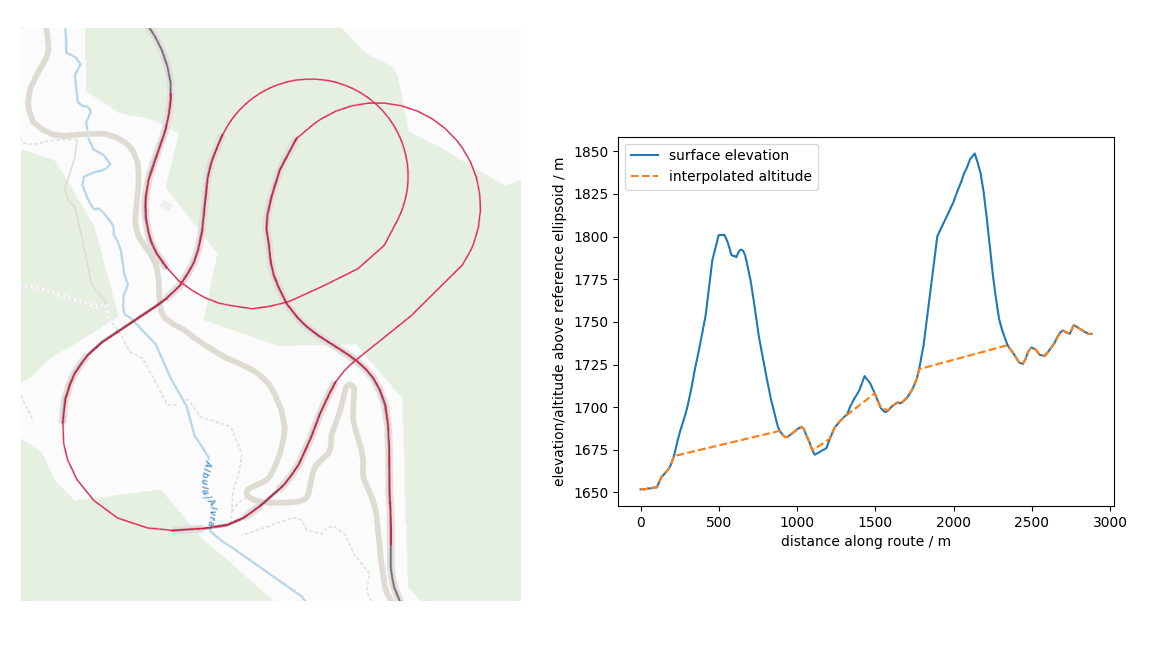
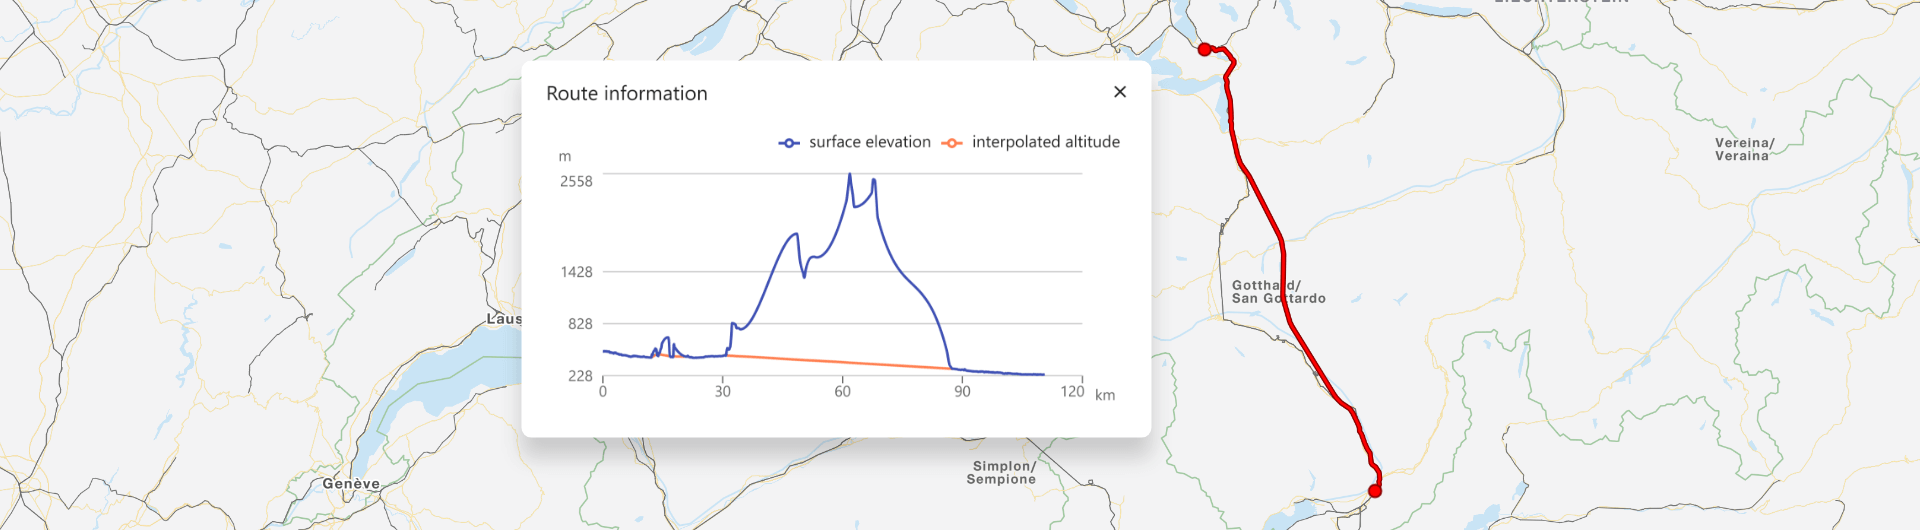
Figure 1: Example of a route with associated elevation profile.
But how do we get from a simple request like go from A via B to C with means of transport X to a route with elevation profile? The best way is to proceed in order:
Determine the route
The first step is to determine the route. geOps has already established a working solution for this: The Route API. More information can be found in our Developer Portal The output of this interface basically consists of an ordered sequence of 2D coordinates on an idealized earth surface, or more precisely the WGS84 reference ellipsoid. The output format here is GeoJSON.
The Route Decorator service
Now it is necessary to enrich these trajectories with additional data. For example, in addition to the elevation values, the distance traveled must also be calculated. For this purpose we have developed a self-contained additional service, the so-called Route-Decorator. This is a Python backend (implemented with Flask) with a simple interface that accepts a GeoJSON and returns it enriched with desired additional information. A modular structure ensures that new program parts for the computation of different auxiliary information can be easily supplemented.
The advantage of the implementation as a self-contained service is to be able to enrich not only outputs of the own routing backend, but in principle arbitrary GeoJSON inputs. The price one pays for this flexibility is a loss in performance. This is because the elevation values, for example, have to be extracted from a database for each query and are not stored directly as additional information in the routing backend.
Add elevation data
For the elevation values, we currently use data from the Shuttle Radar Topography Mission (SRTM) . We have stored these in raster tiles in a PostgreSQL database using PostGIS Raster . If one were to use this pixel data directly, for example, only by querying the nearest measured value, unnatural jumps in the resulting elevation profiles would result due to the limited local resolution. Therefore, for each input point, the four nearest neighbors are queried from the database and the elevation value is calculated using bilinear interpolation. Bilinear interpolation can be written as a scalar product of a vector a with a matrix M applied to another vector b, which corresponds to an evaluation of a bilinear form. Thus, the interpolated heights can be written as:
Since a course can consist of many points (e.g. N= 10000), NumPy is used for this. For those who don't know NumPy yet, here is a small code snippet as an appetizer for a way to evaluate many bilinear shapes in one go without using a slow Python loop:
numpy.einsum(
  "im,imn,in->i", # sum (a_im * M_imn * b_in) over m and n, but not i
  a_im, # datastructure containing multiple vectors
  M_imn, # multiple matrices
  b_in, # multiple vectors
  out=coords[:, 2], # write output directly to z-component of coordinates
)
The bottleneck here is ultimately the database query used to generate the input vectors and matrices.
Tunnels and bridges
At this point, we would actually be done if it weren't for these inventions called tunnels and bridges. Because ultimately, of course, one is interested in the elevation profile along the infrastructure used (road / rail). As we know, roads and rails can pass over bridges and through tunnels, and the differences in elevation between the natural earth surface and the infrastructure can sometimes be severe. With our separate approach, there are two problems to be solved at once:
- identify where a route passes through a tunnel or over a bridge
- correct elevation data for these sections of the route
For this we use OpenStreetMap (OSM) as a data base. The OSM data is prepared in a pre-processing step. First, a graph of all OSM-Ways classified as bridge or tunnel is created. We call each connectivity component of this graph a network. From these networks, geometries can be created, which can be used to detect whether the route goes through a tunnel or over a bridge.
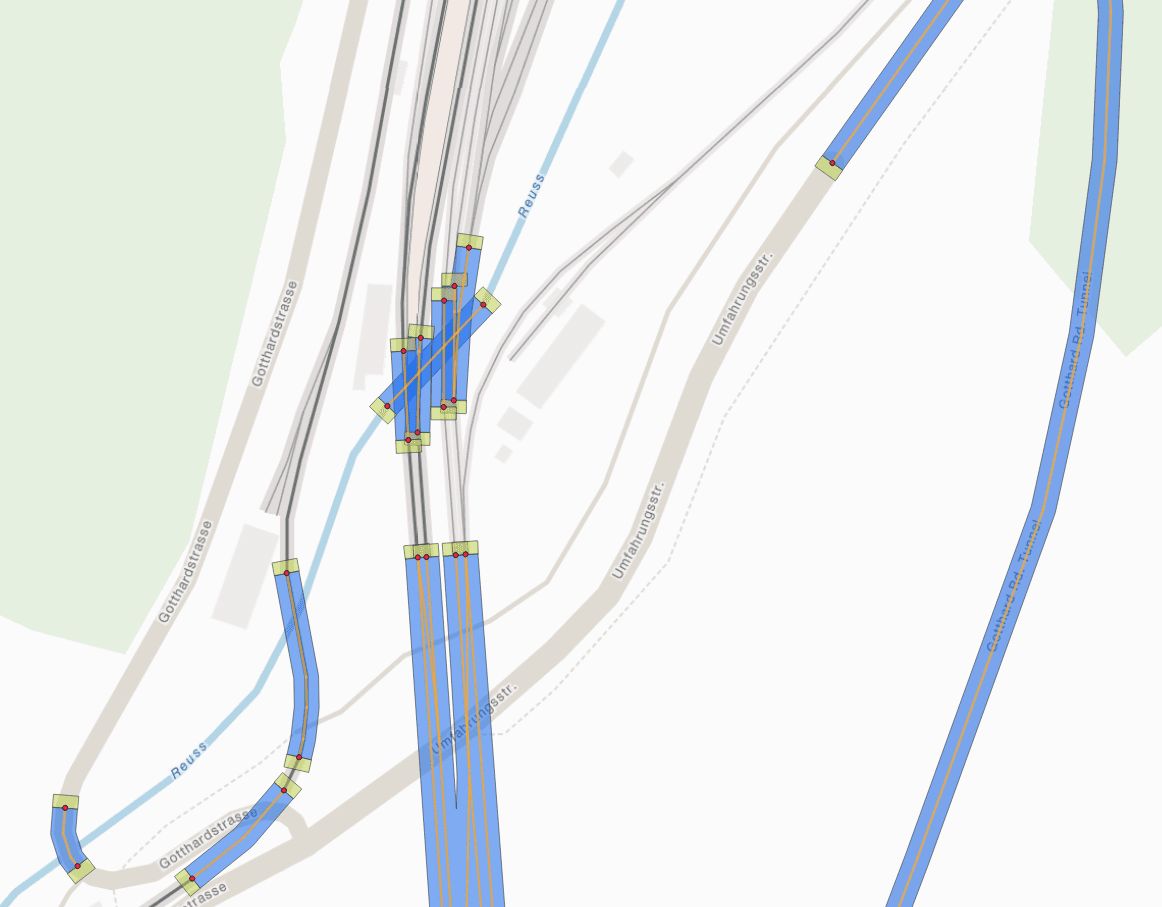
Figure 2: Geometries of tunnel/bridge networks from OSM data: Blue: network polygon. Green: input polygon. Red: input point. Orange: line geometry with interpolated elevation data..
During the recognition process, it must be taken into account that several network polygons may overlap (for example, in the case of partially parallel tunnels for outbound and return directions). Furthermore, a route may intersect a network polygon without passing through an entrance, for example in the case of a road passing under a bridge. Thus, it is important that both the route of the tunnel or bridge and the associated entrances are considered in the decision process. For resolving conflicts in the presence of multiple possible tunnels, we use an iterative approach, which allows clusters of mutually overlapping networks to be gradually resolved using a ranking. The distance of the route to the respective entrances serves as a measure for the ranking. Once the appropriate tunnels and bridges have been found, the vertices of the route can be projected onto the nearest line segments of the assigned networks and the height can be obtained by linear interpolation along the distance between the known heights at the beginning and end of the respective segment.
The question remains as to where the elevation values assumed to be known here come from within a tunnel/bridge network. Let's take a step back and formulate the problem a bit more abstractly: Given a connected, undirected graph with known values for the height at certain nodes (inputs) and known path lengths along the edges: What is a good estimate for the height values at all nodes that are not inputs? For a simple tunnel with only two inputs, the solution is obvious: linearly interpolate between both inputs along the path length. But what is a good generalization for tunnel systems with more than two entrances and crossings/switches, which occur very frequently in reality?
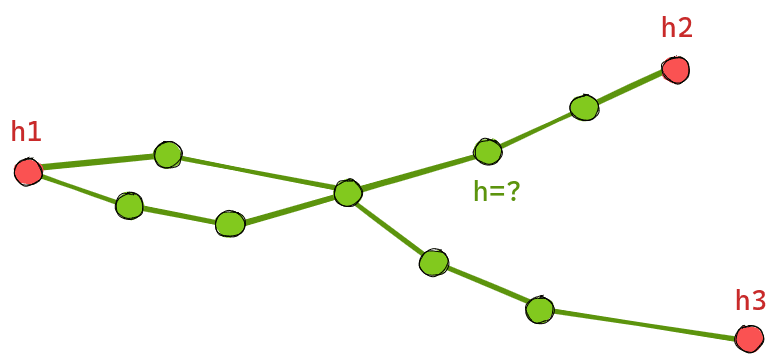
Figure 3: Graph with known heights (red) and unknown heights (green).
Our gut feeling tells us: Somehow unnecessary slopes must be avoided. This gut feeling can be cast into a cost functionf, which assigns to a graph the edge slopes weighted with the edge lengths. If one is not afraid to take paper and pencil in hand, one comes after some transformations to the conclusion that such a cost function is minimized exactly if at each node with unknown height the sum of the incoming edge slopes disappears. Also a look at the trivial example of linear interpolation shows that this is consistent with this, because at every point of a straight line it goes up the hill to the left just as steeply as it goes down the hill to the right, to put it casually. Nice enough, this minimization condition can be written as a linear system of equations, i.e. one finds a matrix A and a vector x, so that for the vectorh of the searched heights holds:
![]()
The numerical solution of this is a one-liner with Numpy:
# h: vector of unknown elevations
# matrix A and vector x depend on edge lengths, graph topology and known elevations
h=numpy.linalg.solve(A, x)
For the processing of the graphs NetworkX is used.
Thus, we have all the components together to generate an elevation profile for a given route along the infrastructure used by the transportation system. Figure 1 shows an example of an elevation profile generated using this methodology. If you want to try it out yourself, you can do so in our Routing Demo: select start and destination and then click on Route information.
The method could even be extended to use not only the entrances as nodes of known height. If more is known about a particular tunnel or bridge (e.g., the elevation at a vertex), this information can also be incorporated into the linear system of equations.
Lessons Learned
Sometimes it pays to take a step back and approach a problem with paper and pencil first. In the Python universe, NumPy and NetworkX are powerful tools that can make the connection from paper back to code in an elegant way.