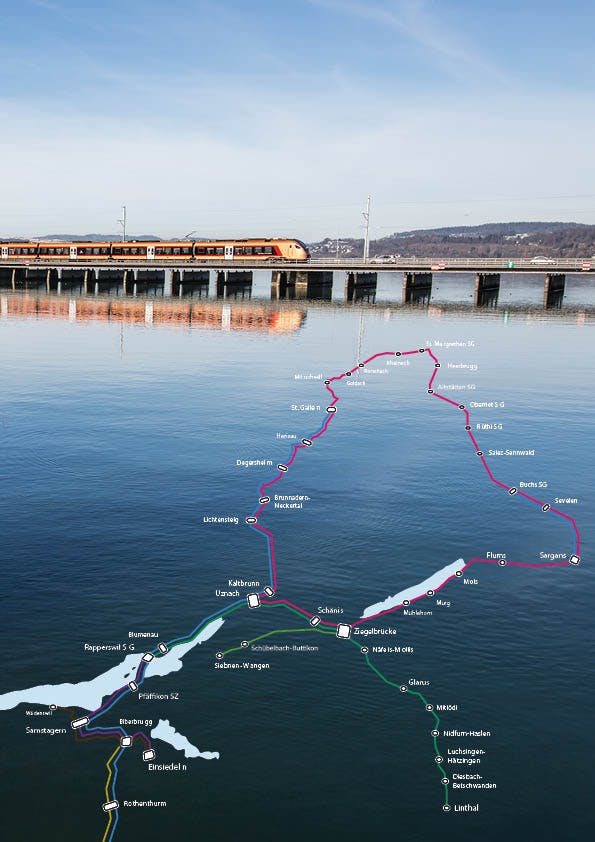
Live Maps show the positions of public transport vehicles on a map.
In the basic version, the vehicle positions are extrapolated on the basis of the target timetable, i.e. the medium- and long-term planned timetable offer. Train delays, cancellations or diversions are ignored. The resulting representations are therefore only suitable to a limited extent as traveler information. However, they can provide a good overview of what public transport is actually offering. These approaches are also popular with planners and decision-makers, as there is also the option of visualizing various planning scenarios. Our globally available representation of public transport is largely based on target data.
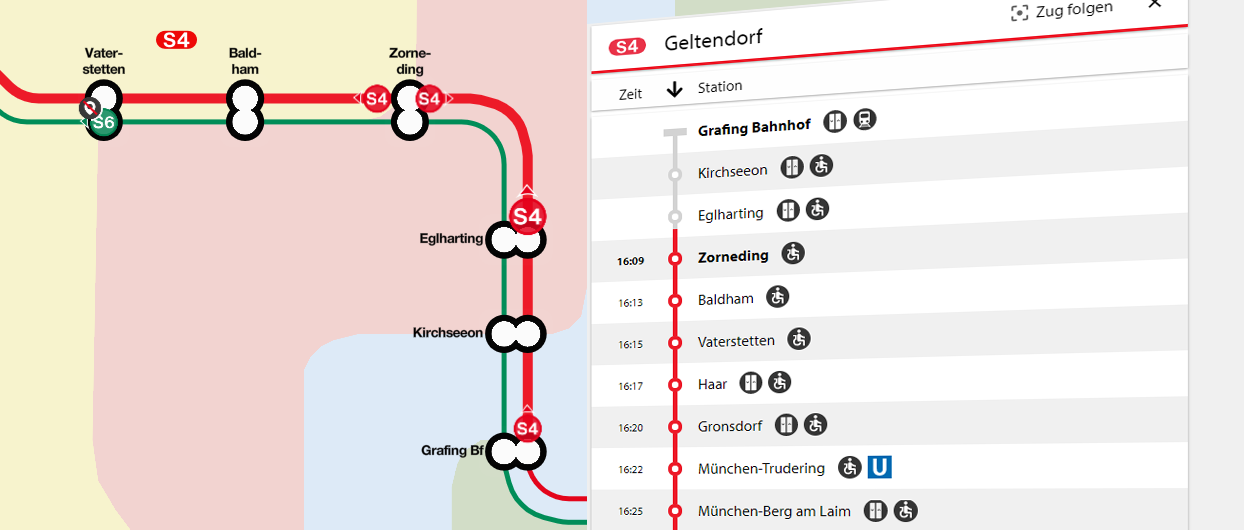
Solutions that take continuously updated deviations from the planned arrival and departure times ("delays") or information on failures and diversions into account, i.e. real-time data, go one step further in mapping the actual situation of the timetable. By combining the expected positions from the target timetable with the deviations, the representation on the map comes very close to reality. The accuracy of the display depends primarily on the quality of real-time data the control centers of the transport companies can provide. Factors that falsify the result are, for example, the widespread rounding of times to whole minutes, the delayed updating of data, the incomplete mapping of stop times at stations or failures and diversions. Nevertheless, this gives a very good picture of the current operational sequence.
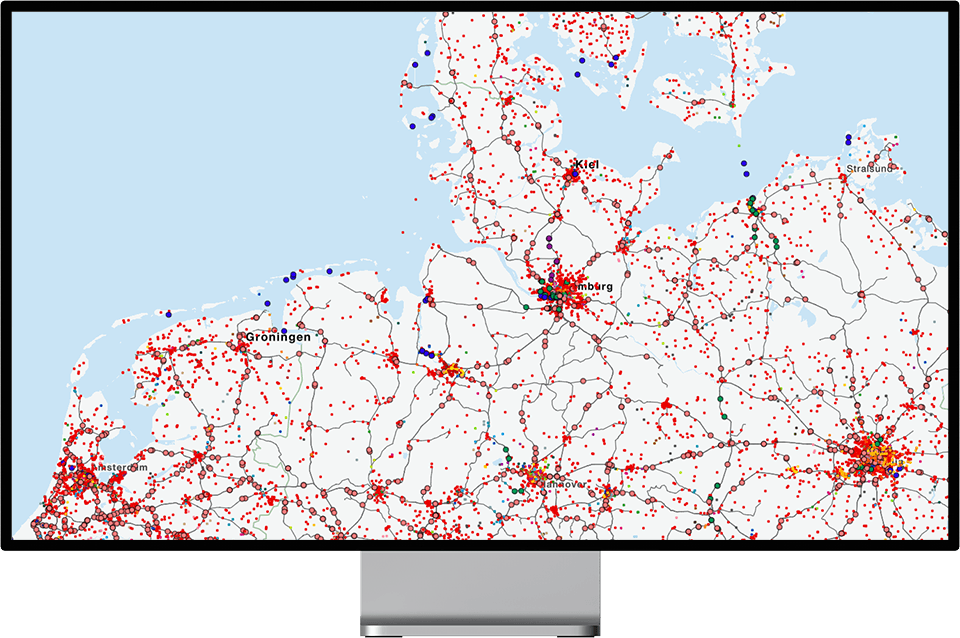
A good example of such a Live Map is the Swiss Federal Railways SBB punctuality map. Even in extreme situations such as the heavy snowfall on January 15, 2021, it showed exactly which vehicles had failed or how few trips were still being made.
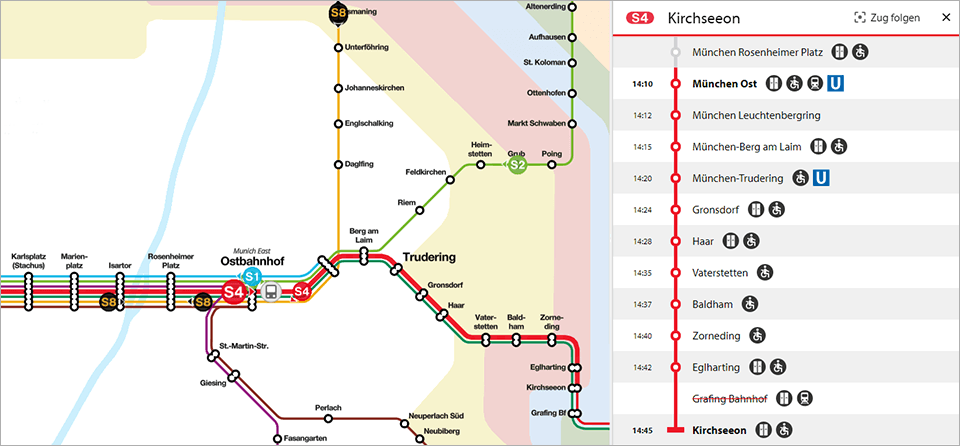
Live Maps generate the greatest added value when, in addition to the target timetable and the forecast deviations, the actual position of the vehicles is taken into account. Our TRALIS system is able to combine these three sources of information. Vehicle positions from GPS receivers or other positioning systems not only serve to display the position of the vehicles on the map as precisely as possible, but they are also used to validate the forecasts from the control center. Unrealistic forecasts can be identified using travel times. If the minimum travel time known in the system to the stop is longer than the forecast, the forecast arrival time can be corrected upwards. On the other hand, the system must rely on the forecasts from the control centers if the control centers predict a later point in time for arrival than can be expected based on the driving time alone. Because the overview from the control center alone knows the possible obstacles and restrictions that lie in front of the located vehicle.