geOps News 2022
Dear readers
In our current newsletter we present the latest developments of our products and inform you about exciting projects.
You can also find out at which trade fairs you can meet us this year. The first opportunity to do so will be in three weeks' time at the IT-Trans in Karlsruhe.
We hope you enjoy reading this issue!
mobility-portal
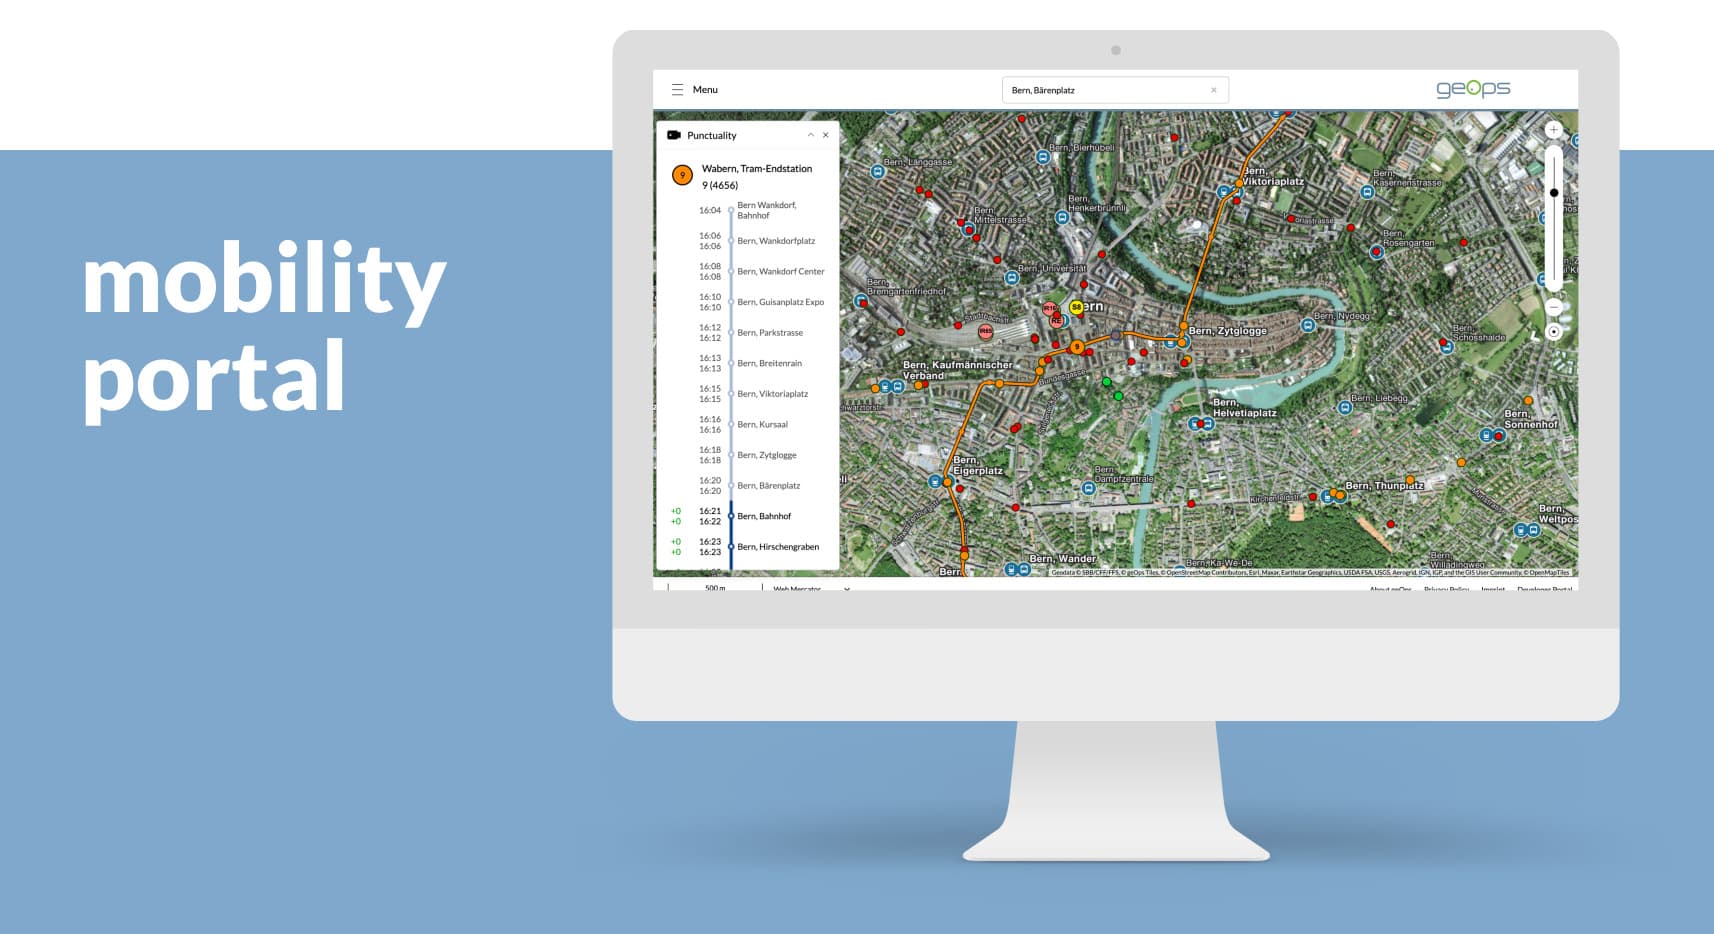
Our mobility-portal is a showcase for many public transport maps and plans. We have continuously adapted the portal in recent months and added new map topics.
We are particularly pleased that our global public transport tracker is integrated into the portal. In this context, we have connected the tracker to our data hub TRALIS. In the previous versions of the tracker, only data that was available in GTFS format was displayed. With the new version based on TRALIS, we can now use a wide variety of formats and interfaces for target and actual data, including the interfaces TRIAS and OJP, which are widely used in the professional environment. We are thus creating the possibility for transport companies that do not publish their data as GTFS, or where the GTFS data does not contain all the required information, to use the Tracker to display the real-time positions of their vehicles.
Of course, we can also provide independent instances of the tracker for the specific requirements of a company, in which the vehicles of other companies are hidden, or in which a display matching the corporate design of the company is implemented.
Our new satellite map is also integrated as a background in the mobility-portal. As with our standard maps, the satellite map also displays important public transport data, especially rail lines and stops.
Public transport network plans
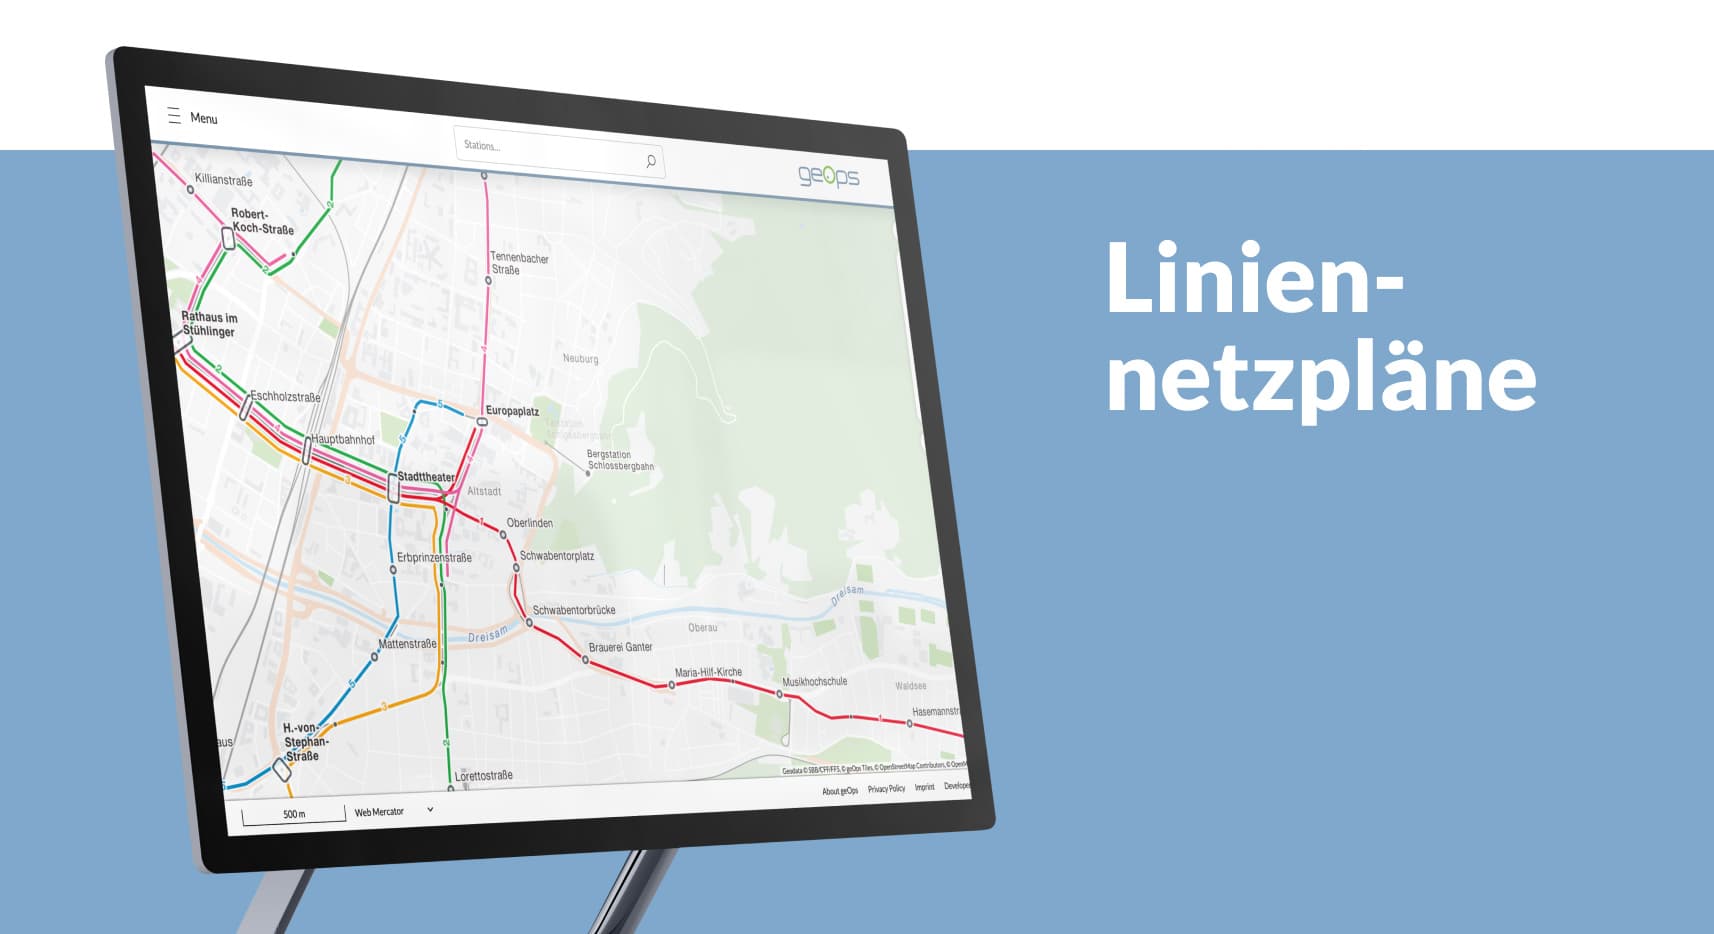
With our maps for public transport, we want to cover all the needs of traveller information. In addition to detailed, geographically accurate maps, travellers also need quick, abstract overviews of all travel options or tariff constellations. We have therefore added this type of presentation to our portfolio.
We create our line network plans with a largely automated process based on timetable data. A few configuration settings are enough to create customised plans for a selection of lines, transport companies, regions or other criteria.
With our solution, we do not want to compete with plans that are created by graphic designers and manually optimised in detail. However, our plans offer the advantage that they can be flexibly filtered according to a wide variety of aspects and can be continuously updated automatically with new data. Last but not least, the cost saving is an important argument for the decision in favour of automatically created plans.
If you want to know more about the range of route network plans, we recommend the article on our website or the test of some examples in the mobility-portal.
Map of tariff associations
As part of our mandate for SBB, we are pursuing the goal of converting many of the standard maps that SBB has long produced for passenger information to increasingly automated production processes. The aim here is to keep the maps up-to-date through frequent and efficient updates and to ensure consistency with other information channels by connecting them to central data sources. The cost savings are another advantage.
Having already used NOVA, the central database for the Future Price System of Public Transport Switzerland (ZPS), for the nationwide display of fare zones in previous years, we were now able to use NOVA for the automatic creation of the fare association map. You can see the result under this link. If you are interested in the details of the map, we recommend this blog post.

International direct connections
With a new map for SBB, we show all direct connections from Switzerland to European cities. The exact routes of the trains are differentiated according to day and night connections. With one click, all intermediate stations can be displayed. Links for further information and booking options are shown for each connection. The map is embedded on the SBB website.
To make it easier for the product managers at SBB to record the connections, our GeoCMS Cartaro and our Routing are used.
Editorial tool for disruption and construction site reports
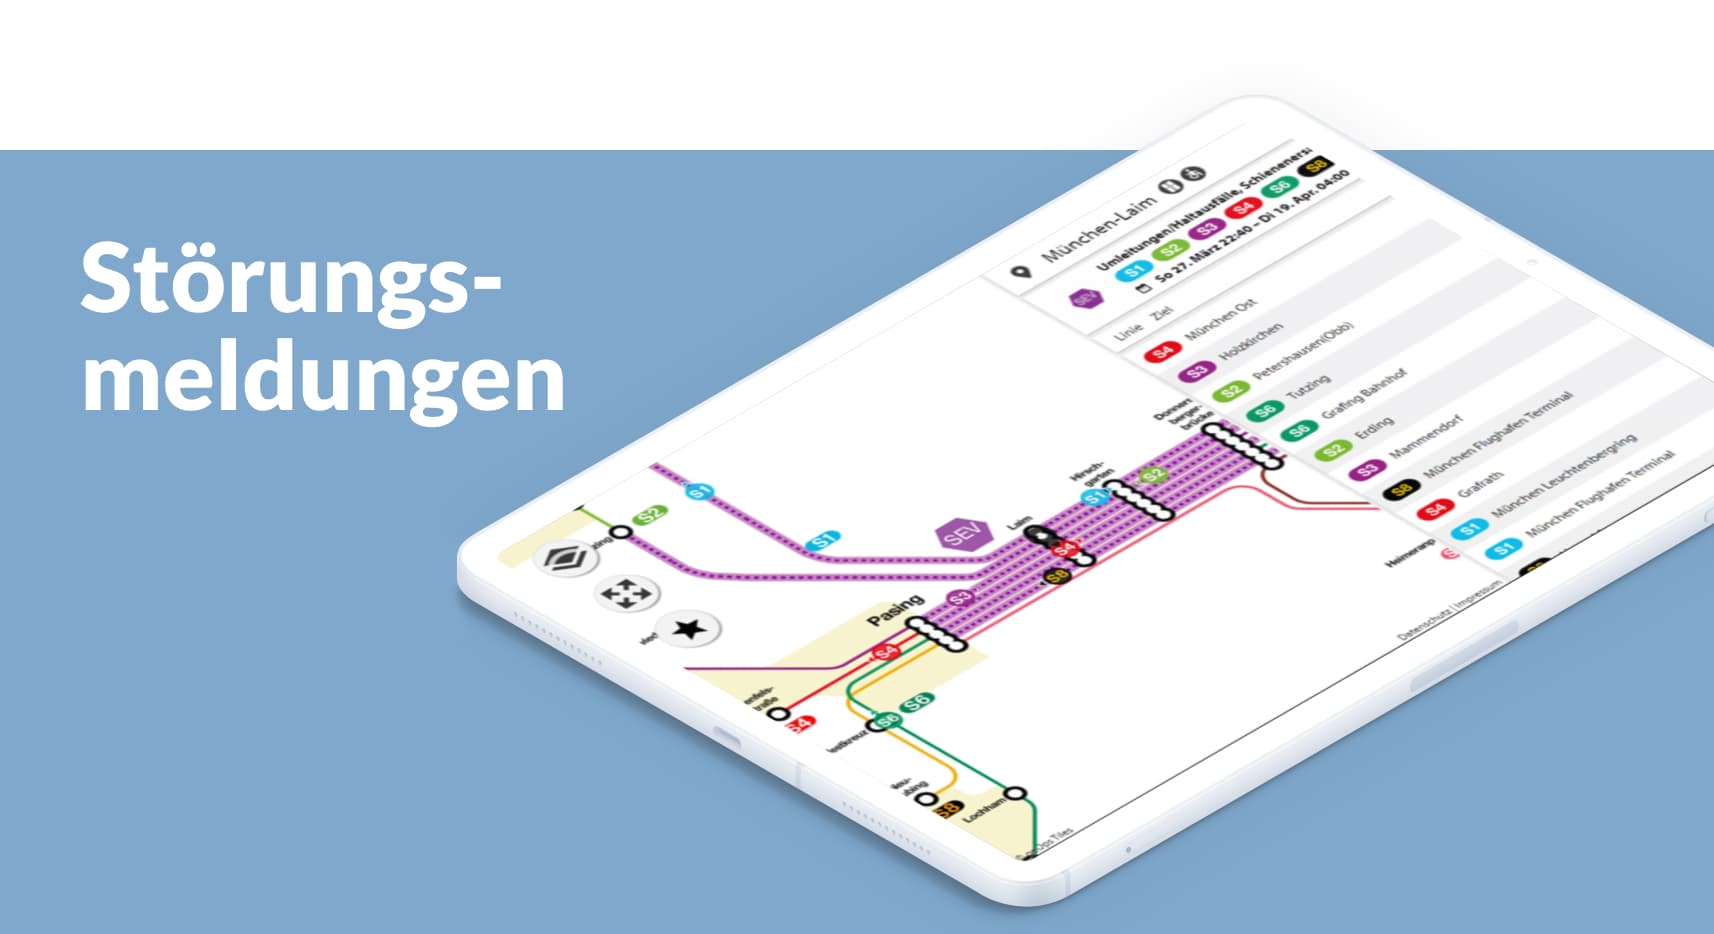
Over Easter, work was hard in Munich and at geOps. From Maundy Thursday evening until the Tuesday morning after Easter, there was a major construction site in Munich-Laim, which resulted in changes in frequency, rail replacement services, diversions or interruptions on practically all lines. Those responsible for the Munich S-Bahn used MOCO, our editorial tool for disruption and construction site communication, to communicate the current situation to passengers. By integrating the display into the LiveMap, passengers were able to see the current train runs and the disrupted areas at the same time. With a click, the detailed information stored with the messages could be called up.
MOCO was originally developed for SBB to communicate disruptions via a map on the general displays in the large stations. In the meantime, MOCO has developed into a flexible tool with which messages can be visualised not only on maps but also on line network plans and output on a wide variety of channels such as displays, websites, apps or print.
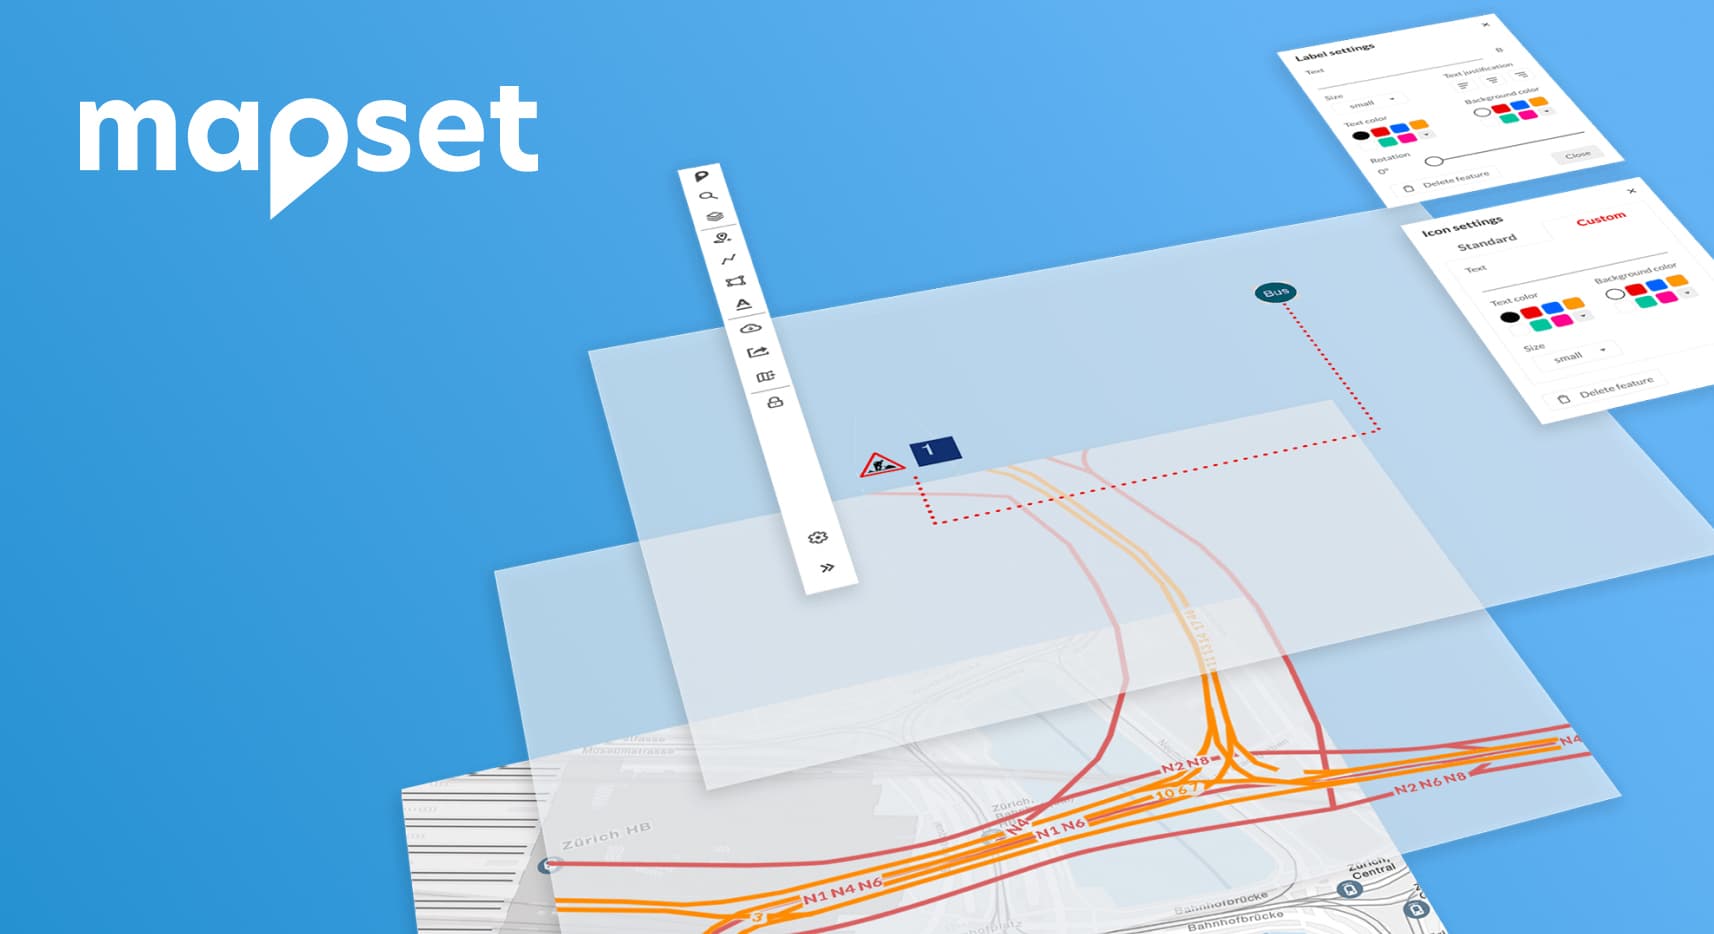
mapset
mapset is our online tool for drawing situation plans around bus and train stops. In recent months, we have added numerous functions to mapset. These include, for example, the possibility to rotate plans deviating from the north orientation or the addition of satellite images as plan backgrounds.
The best way to test the new functions of mapset is to use the demo version at mapset.ch. If you would like us to keep you up to date on all the new features of mapset, we recommend that you subscribe to the mapset newsletter.
Events
This year, there will finally be a number of trade fairs, conferences and other events at which we will be presenting our services. We would be pleased to welcome you personally at one of these events.
IT-Trans
From 10 to 12 May, the IT-Trans, the leading international conference and trade fair for intelligent solutions in public transport, will once again be held at the Karlsruhe Exhibition Centre. Meet us in the dm-Arena at stand 6. Please write to us if we can provide you with a free admission ticket from our contingent.
GEOSummit
On 1 June we will be participating in the exhibition at the GEOSummit. The GEOSummit is the event of the GIS industry in Switzerland. This year, the GEOSummit is especially interesting for us, as the conference taking place at the same time will focus on mobility. In addition, this year's GEOSummit will take place at the University of Applied Sciences Northwestern Switzerland in Olten, which is right on our doorstep. We would be happy to arrange an appointment with you on the occasion of the exhibition.

VöV General Assembly
On 8 and 9 September you can meet us at the General Assembly of the Association of Public Transport VöV in Lausanne. Please write to us if you will be there. We would be very happy to arrange a personal meeting with you.

Your contact to us
We would be happy to keep you up to date with all the latest news at geOps with our newsletter. Do you know someone who would be interested in receiving the newsletter? Then simply forward this mail or refer them to our newsletter subscription.
Are you specifically interested in mapset? Then we recommend that you also subscribe to our mapset newsletter.
If you have any questions or would like personal advice, please do not hesitate to contact us.
We look forward to your questions and reactions.


